Power Tools
Veriground tools connect your firm directly to on-the-ground weather at the locations that matter. All tools draw from the same network of ground stations, reporting conditions within hours. Sign in to get started — no prior experience needed.
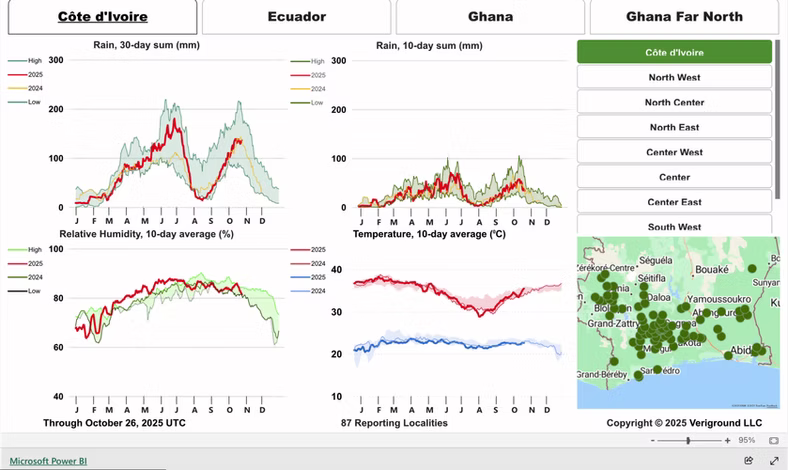
Regional Reports
Pre-built weather charts for cocoa-growing regions in Côte d'Ivoire, Ghana, and Ecuador with no setup required. Track rainfall, temperature, and humidity reported directly from Veriground ground stations, typically within hours of each reading. Compare current conditions against historical highs and lows to put today's weather in context for your agribusiness decisions.
Learn More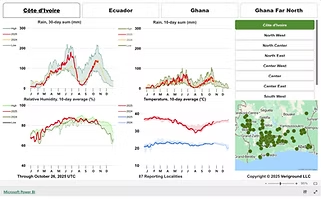
Analytics
Download ready-to-use Power BI files and connect via API. Build custom views across rainfall, temperature, and humidity for cocoa-growing regions.
Learn More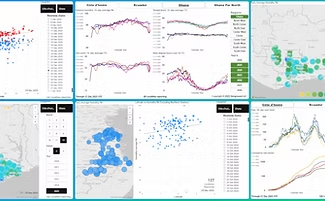
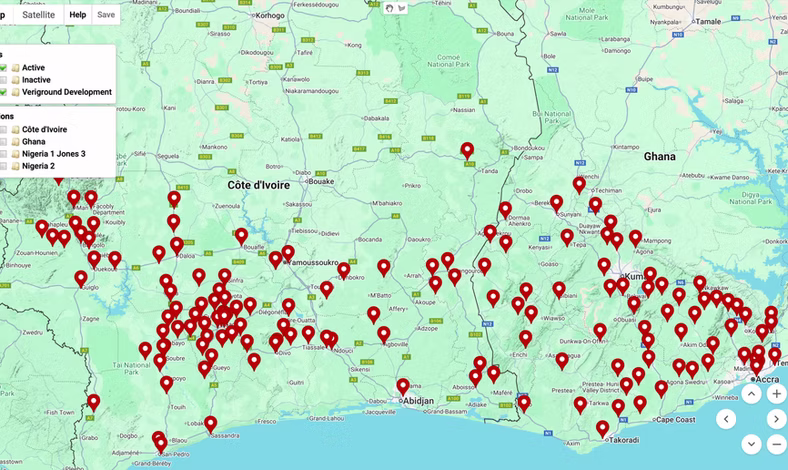
Regions & Site Designer
Draw custom boundaries around any area — a single farm, a cooperative, or an entire growing region. Weather data aggregates to your shape instantly.
Learn More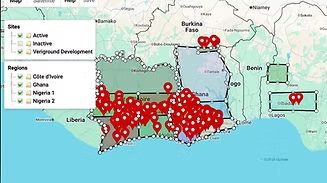
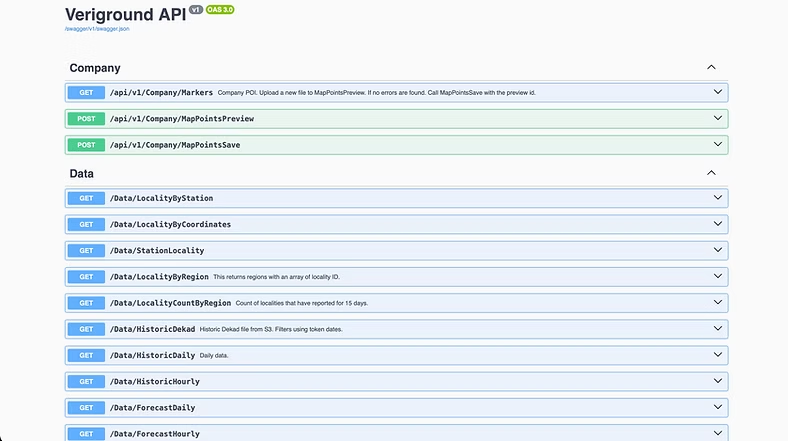
Data API
Integrate Veriground weather data directly into your own platform. The API delivers readings at the locality level — each reporting site — along with region summaries and historical records.
Learn More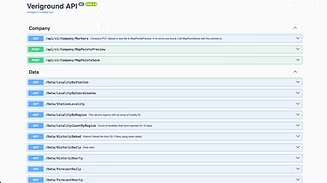
Find the Right Fit
Veriground offers a range of access options — from web-based reports to full API integration, hosted data services, and custom deployments. Tell us about your operation and we'll put together the right combination.
Contact UsAccess Levels
Choose Your Level of Access
From on-demand regional reports to full API integration and farmer-facing forecasts — each tier builds on the last.
-
Regional Reports
- Ivory Coast
- Ghana
- Ecuador
-
Hosted Dashboards
- Ground Weather Mapping
- Harmattan Index
- Humidity Mapping
- Seasonal Rainfall & Temperatures
- Rain Forecasts
- Dew Point
- Everything in Tier 1, plus:
- Custom Regions & Strategic Areas
- Power BI Dashboards for local data mixing
- API Access
- Tier 1 access for your entire organization
- Tier 2 tools for your analysis teams
- Sustainability program acceleration with Veriground forecasts delivered to farmers
- Ghana trials: up to 60% improvement in productivity with accurate forecasts guiding agro-input use